

Quality Assurance
Johnson Enterprises strives to be the best in quality!
We are committed to giving our customer’s our top priority by:
- Producing parts that meet or exceed customer specifications
- While delivering parts on time
- At competitive prices
- With outstanding customer service
“Quality parts start with quality thinking”
Johnson’s Management Team meets and tracks weekly to discuss on-time deliveries, scrap, and deviations. Management also meets quarterly to evaluate quality performance and customer satisfaction. The company is committed to continuous improvement in all areas to ensure high quality and productivity. We take great care to ensure proper documentation of all orders occurs, including the agreed-upon delivery date, the correct revision number of each part, the purchase order number, and appropriate drawings are available. We develop a Shop Traveler for each order to follow the production process. We maintain Identification and traceability as necessary. We retain drawings and quality control documents for each order at Johnson for five years.
All orders released to the Shop floor have process checks throughout manufacturing, including quality control first part quality checks. If a non-conformance occurs, the part is segregated and marked for further disposition. An NCR (non-conformance report) is initiated with corrective/preventative actions to prevent further quality deviations.
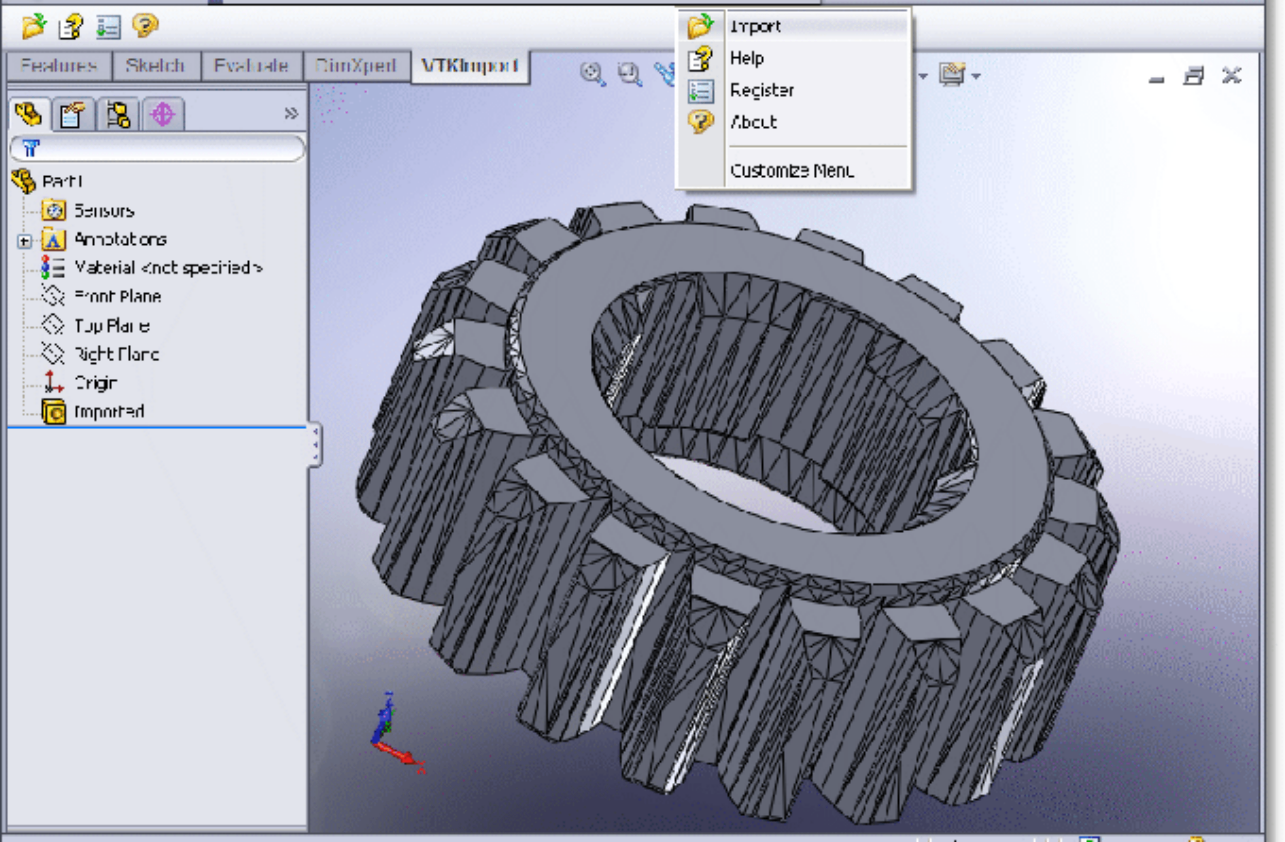
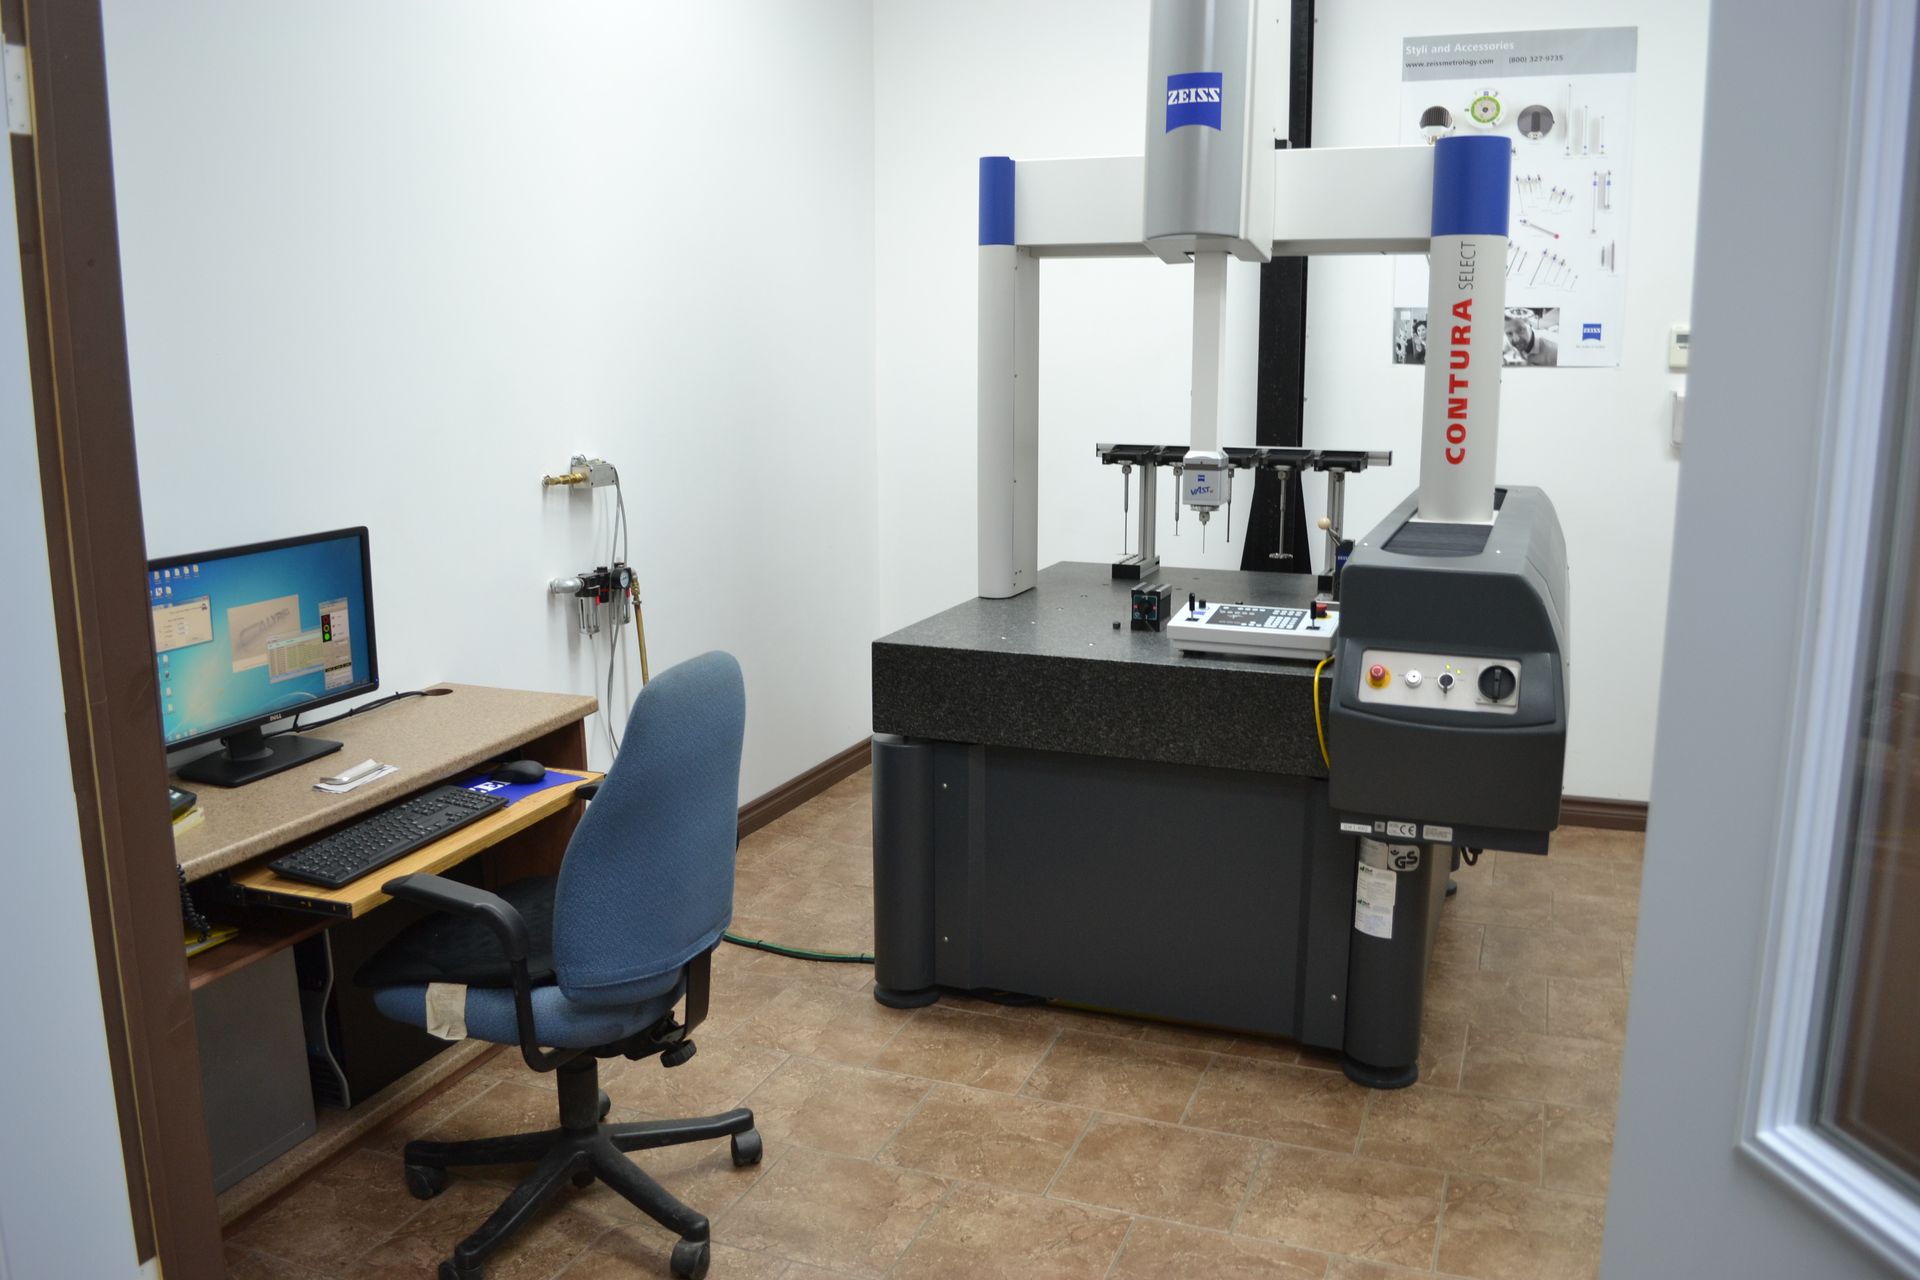
Johnson maintains manual measuring instruments calibrated, recorded and logged on a database. We also have a Computerized CMM (Coordinate Measuring Machine), which we extensively use to maintain quality levels. We enhance prints for quality control purposes, including developing inspection test plans.
Our shop is filled with high quality, well-maintained production equipment. A well-trained workforce and quality processes enable Johnson to sustain a high-caliber level of Service. Excellent working conditions and our climate-controlled QA room further enhance our quality levels.
Johnson’s shipping department takes special care in marking, preserving, and packaging the product to ensure parts arrive in excellent condition and are appropriately identified at the customer’s location.
Let’s build something powerful together.
Call Us
Email Us
Opening Hour
Mon - Thu : 7 am – 4 pm
Fri : 7 am – 12:45 pm
Sat - Sun : Closed
Address
69 Chem. Lac des Lys, Val-d’Amour, NB
Contact us
Contact Us
We will get back to you as soon as possible.
Please try again later.


